

Intuition is no longer being funded. Simply believing that a business initiative is a good idea is not sufficient to secure the attention, resources, and commitment to implement it and to sustain its viability. A business case, based on sound logic and defensible assumptions, is required.
Trust is a case in point. Intuitively, business leaders understand that customers' trust is the foundation upon which authentic, productive, and long-term relationships are built—an outcome sought by all companies competing on the basis of customer centricity. But are investments in securing that trust worthwhile? This article describes a methodology to allow senior executives to make that assessment. Consisting of four steps, it requires understanding the:
- Distribution of trust in the population of customers
- Potential to heighten the level of trust for a select subset of customers
- Likelihood of customers whose trust has been enhanced to exhibit value-creating behaviors
- Incremental value generated by those behaviors
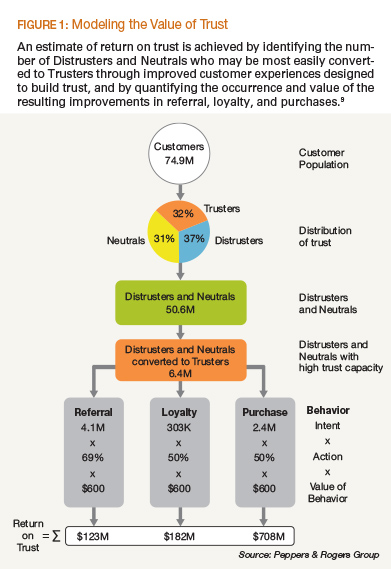
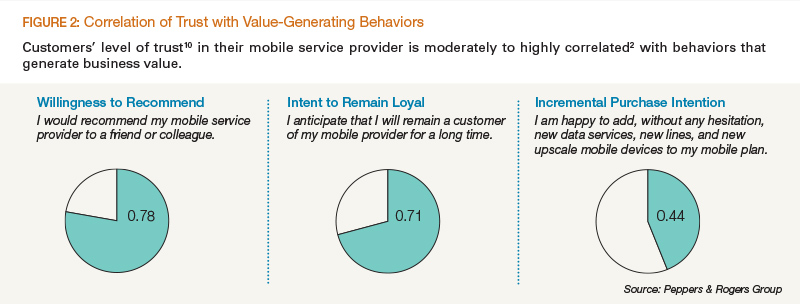
To illustrate this customer-level approach to modeling the value of trust (see Figure 1), consider customers' trust in mobile service providers in the U.S. Using insights from research conducted by Peppers & Rogers Group,1 it is known that customers' trust is moderately to highly correlated2 with willingness to recommend, intent to remain loyal, and incremental purchase intention (see Figure 2). If customers' trust improves, then to what extent does the occurrence of these behaviors change—and what might that be worth to the business?
Distribution of trust
To begin to answer that question, it is first necessary to know the composition of a company's customers by trust level—estimates of which may be gained through primary customer research. For mobile service providers, 32 percent of customers actively trust their provider, and are referred to as Trusters; 31 percent passively trust them, and are referred to as Neutrals; and 37 percent actively distrust, and are referred to as Distrusters.10 For a major mobile service provider in the U.S. with approximately 74.9 million customers,3 this equates to 27.6 million Distrusters and 23.0 million Neutrals.
This information sets the upper limit on the size of the opportunity. If the company changed its behavior toward customers such that all 50.6 million Distrusters and Neutrals became Trusters, then the gain would be maximized. Although an appropriate aspirational goal, it is unlikely to be achieved. Realistically, what percentage of Distrusters and Neutrals might the company be able to grow into Trusters?
Trust capacity
To answer that question, it is necessary to know the trust capacity of the Distrusters and Neutrals—the extent to which these customers are disposed to generally being trusting and having confidence in others. Obtained through primary customer research, trust capacity is an average of ratings to three questions:4
- Trust: "Generally speaking, would you say that most people can be trusted, or that you can't be too careful in dealing with people?"; rated on a scale from "Can't be too careful" (0) to "Most people can be trusted" (10)
- Fairness: "Do you think most people would try to take advantage of you if they got a chance, or would they try to be fair?"; rated on a scale from "Would take advantage of you" (0) to "Would try to be fair" (10)
- Helpfulness: "Would you say that most of the time people try to be helpful, or that they are mostly just looking out for themselves?"; rated on a scale from "Just look out for themselves" (0) to "Try to be helpful" (10)
Distrusters and Neutrals who have a high trust capacity5 are largely disposed to being trusting—but specifically lack trust in their mobile service provider. These are the customers who may be most receptive to initiatives by the mobile service provider that enhance trust and are therefore the individuals who may be most easily converted to Trusters. For a major mobile service provider specifically, it is estimated that 5 percent of Distrusters (1.4 million customers) and 22 percent of Neutrals (5.1 million customers) have a high trust capacity. Does this total of 6.4 million customers serve as a realistic estimate of the size of the opportunity for a major mobile service provider?
Value-generating behaviors
To answer that question, recognize that not every Truster will exhibit the value-generating behaviors that are of interest—recommending the mobile service provider, remaining loyal, and making additional purchases—and not every Distruster or Neutral will fail to exhibit those behaviors. Reality is more complex, and estimates must be adjusted to account for the fact that only a percentage of Trusters will exhibit those behaviors, and that a percentage of Distrusters and Neutrals already exhibit those same behaviors.
To avoid overstating the potential benefit of growing these 6.4 million customers into Trusters and to more accurately reflect the incremental benefit of enhancing customers' trust, the percentage of Distrusters, Neutrals, and Trusters who intend to exhibit each outcome behavior (obtained from primary customer research) is used to reduce the quantity of customers expected to grow into Trusters.6 For example, in the case of referral behavior, 3 percent of Distrusters, 22 percent of Neutrals, and 78 percent of Trusters intend to recommend their mobile service provider to a friend or colleague, based on primary customer research. The 1.4 million Distrusters with high trust capacity are reduced by 3 percent to 1.3 million, the 5.1 million Neutrals are reduced by 22 percent to 4.0 million, and the sum of the two, representing the total number of new incremental Trusters, is reduced by 22 percent (100 percent minus 78 percent) to yield an estimate of 4.1 million new incremental Trusters who may refer.
For loyalty, the business benefit is based on churn reduction, with 26 percent, 5 percent, and 1 percent of Distrusters, Neutrals, and Trusters indicating that they do not anticipate remaining a customer of their mobile service provider for a long time. Similar calculations, to estimate the reduction in the number of new Trusters who intend to churn, yield an estimate of 303,000 customers retained.
In the case of purchase behavior, the corresponding percentages are 2 percent, 3 percent, and 41 percent for Distrusters, Neutrals, and Trusters who state that they are happy to add new data services, new lines, and new upscale mobile devices to their mobile plan. Performing parallel calculations yields an estimate of 2.4 million new incremental Trusters who may make additional purchases.
In summary, as a consequence of the mobile service provider enhancing the trust of a subset of Distrusters and Neutrals, it is estimated that 4.1 million customers intend to refer who otherwise would not have done so, that 303,000 will be retained who otherwise would have been lost, and that 2.4 million will make additional purchases that otherwise would not have occurred. What is the financial worth of these customer behaviors to a mobile service provider?
Incremental value
To answer that question, the quantity of each of the customer behaviors is multiplied by an estimate of the average value generated by that behavior.
For referral, 69 percent of mobile service customers willing to recommend actually do so; 3.6 recommendations are made; and 2 percent of those prospects who receive a recommendation are driven to buy as a result, each of which is valued at $600.7 Applying these factors multiplicatively to the 4.1 million customers who now intend to refer because of enhanced trust in the mobile service provider results in an estimated incremental value of $123 million.
For loyalty, 50 percent of mobile service customers intending to switch to a competitor actually do so, each of which is valued at $600.7 Applying these factors multiplicatively to the 303,000 customers retained because of enhanced trust in the mobile service provider results in an estimated incremental value of $182 million.
For purchases, 50 percent of mobile service customers intending to add new data services, new lines, and new upscale mobile devices to their mobile plan actually do so, each of which is valued at $600.7 Applying these factors multiplicatively to the 2.4 million customers who now intend to purchase because of enhanced trust in the mobile service provider results in an estimated incremental value of $708 million.
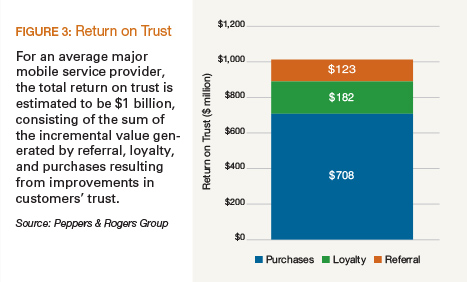
In total, the estimated return on trust is $1 billion for a major mobile service provider, equal to the incremental value generated by migrating Distrusters and Neutrals to Trusters and thereby improving referral, loyalty, and purchases (see Figure 3). Achieving these benefits is not predicated on realizing massive modifications in the behavior of Distrusters and Neutrals—in fact, it implies that only 5.6 percent of them will now recommend, 0.6 percent will now remain loyal, and 2.3 percent will now purchase additional products and services as a consequence of heightened trust in their mobile service provider. These are comparatively small shifts in customers' behaviors, yet they equate to substantial success.
Securing a return on trust requires an organizational commitment to act in customers' interests, a business model that allows the company to create shareholder value through that commitment, and a strategy that leverages both to achieve competitive advantage. More tangibly, it also requires time and money. It takes time to nurture and grow customers' trust—the amount of which can be estimated by longitudinally monitoring trust levels across the lifecycle for customer cohorts and by observing the frequency and timing of the occurrence of the value-generating customer behaviors (referral, loyalty, and purchases). And, it takes an investment in institutionalizing company behaviors that create customer experiences that engender trust. Fortunately, the company may already be exhibiting many of these behaviors (but not necessarily uniformly for all customer segments or consistently across all touchpoints). The magnitude of the return-on-trust opportunity provides guidance on how much a company may wisely invest in which customer experience improvements.
How does a mobile service provider alter its behavior toward customers so that trust is built, evidenced by customers modifying their behavior toward the company?
Building trust
That question has been answered by empirical research identifying the customer experiences that are known to generate trust with mobile service providers.1 Those experiences briefly include: delivering the basics well, such as a stable and high-speed network, and providing accurate and uncomplicated bills; communicating clearly and transparently, and avoiding marketing gimmicks that may mislead customers; listening carefully to customers, demonstrating an appreciation for their business and apologizing when a mistake is made; and sustaining a strong brand reputation for honesty and for keeping customers' interests foremost in mind. (See "Creating Customer Experiences That Create Trust")
Performing these trust-building activities well demonstrates the proficiency of the mobile service provider in doing things right, because competence builds confidence in the trustworthiness of the provider. A second aspect of trust, however, addresses the complementary facet of doing the right things by having the intent or goodwill to act in customers' best interests. "Both of these qualities are important if you want to be considered trustworthy; either one by itself is not sufficient," explain Don Peppers and Martha Rogers, Ph.D., founding partners at Peppers & Rogers Group. "It does a customer no good, for instance, to deal with the best-meaning company in the world if that company doesn't have enough competence to deliver the product on time or in good condition."8
From assessment to alignment
Creating confidence among senior executives in return on trust and in the business opportunity it represents entails more than calculations. It also requires:
- Consensus, attained by building a coalition of colleagues across organizational areas that support the critical role of customer trust in the company's future.
- Credibility, achieved by openly discussing the assumptions underlying the financial model and presenting the empirical support—and by documenting the downside risk of doing nothing and maintaining the status quo.
- Conversation, about the internal rate of return and the net present value of trust-building activities.
Now is the time to not only assess return on trust, but more important, to also align the organization to realize the business opportunity it represents.
Endnotes
1. Lacki, T. (2012) Creating Customer Experiences That Create Trust. Customer Strategist, 4(1), 25-33.
2. A correlation measures the degree of linear relationship between two variables on a scale, in absolute value, from 0 (independence) to 1 (dependence).
3. An average of the estimated number of subscribers in 2011 for AT&T Mobility, Sprint-Nextel, T-Mobile, and Verizon Wireless using data from: Mobile Operator Metrics, 2011. Pyramid Research, 2011.
4. General Social Survey by the National Opinion Research Center at the University of Chicago.
5. "High" trust capacity is defined by the upper quartile of the rating scale (i.e., with an average rating of the three questions of 7.5 or greater on the 0–10 scale).
6. Intent to exhibit a behavior is based on the percentage of research respondents who rated the survey statement (see Figure 2) at the extreme of the scale. For loyalty and purchases, each of which was measured on a scale from "strongly disagree" (1) to "strongly agree" (7), it was based on a rating of 1–2 (capturing intent to churn) for the former and 6–7 for the latter. For referral, measured on a scale from "not at all likely" (0) to "extremely likely" (10), it was based on a rating of 9–10.
7. Burns, M. (2011) The Business Impact of Customer Experience, 2011. Forrester Research.
8. Peppers, D., and Rogers, M. (2012) Extreme Trust: Honesty as a Competitive Advantage. New York: Penguin.
9. "K" is used to denote "thousands," and "M" is used to indicate "millions."
10. Trust is measured by respondents' rating of the item, "My mobile service provider can be trusted," on a scale from "strongly disagree" (0) to "strongly agree" (10), and classified into Distruster (0–6), Neutral (7–8), and Truster (9–10) categories.