

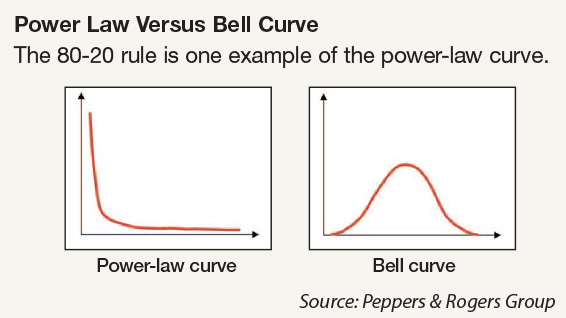
We all appreciate the randomness of life and business, but many of us don’t fully realize the implications of the type of randomness we are subjected to. In many situations the randomness of events is not distributed according to the kind of normal curve, or bell curve, that we all learned in Statistics 101. Rather, some things are randomly dispersed according to what is known as a “power law.”
The famous 80-20 rule, which serves as a good general guide for how customer profits are often distributed, is nothing more than a power law. Also known as the Pareto Principle, the 80-20 rule states that 20 percent of your customers will usually generate about 80 percent of your profit.
The key to understanding why a power law is different from a bell curve is to realize that power laws go on and on with the same kind of distribution. If your customer profits are distributed according to the 80-20 rule, then 20 percent of the top 20 percent of your customers will also produce 80 percent of that 80 percent of profits. In other words, just 4 percent of your customers (20 percent of 20 percent) will account for 64 percent of your profit (80 percent of 80 percent). Multiply it again and you’ll see that fully half your profits will come from less than 1 percent of your customers, etc.
However, power laws work the other way around, as well. If 80 percent of your customers account for just 20 percent of your profits, then 64 percent account for just 4 percent of profits, and a full one half of your customers, altogether, produce less than 1 percent of your profits.
It’s easy to be confused by this, because many of the natural phenomena we observe in everyday life are distributed according to the more intuitively understandable bell curve. To grasp the difference, remember that human height is distributed according to a bell curve, while human income is distributed according to a power law. If you walk down a crowded city street and catalog the different heights of the people you encounter, chances are you’ll occasionally see an adult taller than 6 feet 6 inches or shorter than 5 feet, but the odds of finding someone taller or shorter are vanishingly small.
On the other hand, personal income has no limit and is distributed according to a power law. If human height were distributed the same way personal income is distributed, most people would be in the 5- to 6-foot range of height, but many would actually be shorter than 3 feet tall, and most of these people would be just a few inches high. There would also be people 20 or even 100 feet tall. If you happened to run into the two tallest people in the world, Bill Gates and Warren Buffet, they would each tower over the city, their heads more than a mile in the sky.
Power-law distributions characterize many kinds of measurable quantities that are based on networks, including the increasing proliferation of social networks. Expect power-law distributions to characterize things like the number of comments accumulated by different blogs, or the number of viewers of different YouTube videos, or the number of Twitter followers acquired by various users.
But here’s the point: Economic cycles, like blog comments, Twitter followers, and the popularity of movies, books, or music, come in randomized waves distributed according to a power law. The ups and downs of our economy are not distributed normally, the way you would see things along a bell curve. So keep this in mind the next time you wonder about the severity of a downturn or the upside of a bull market.