

Happiness is hot. Over the past few years psychologists have placed increased emphasis on what makes our lives pleasant, good, and meaningful1—in short, what makes us happy. The disciplines of positive psychology and positive organizational scholarship have emerged to investigate the antecedents and consequents of positive phenomena at the individual2 and organizational3 levels. It’s important, because research has shown that happy people are more successful and healthier.4/p>
Fortunately, happiness isn’t a personality trait5—it is a state that can be taught.6 By modifying behaviors and attitudes through activities such as spending more time socializing and strengthening close relationships, personal happiness is significantly enhanced7—and the impact is long-lasting.8
Awareness and expressions of gratitude and kindness have also been shown to be correlated with individuals’ happiness. For example, when individuals are made more keenly aware of positive events in their lives by keeping a journal of events for which they are grateful, happiness is enhanced.9 The same effect occurs when individuals simply keep count of the number of acts of kindness they perform.10
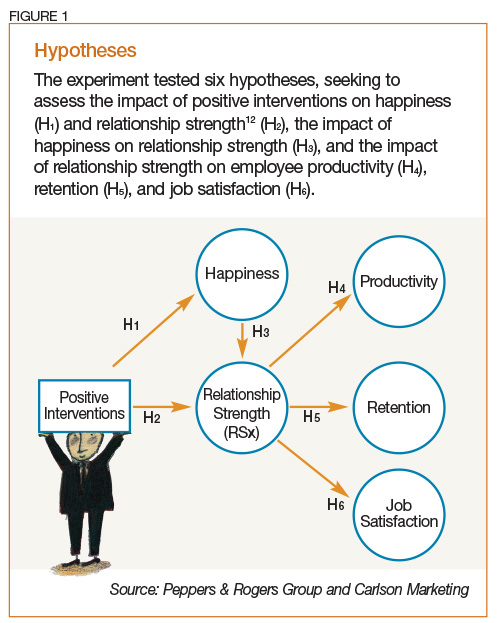
Can these findings be extended into the workplace? More specifically, is it possible to teach employees techniques that increase happiness—and, if so, do heightened levels of happiness improve the strength of the relationship to the employer, which then impacts important business benefits for the company? Peppers & Rogers Group and Carlson Marketing conducted an experimental study to find out (see Figure 1).
Method
The study was conducted within the U.S. headquarters of a business-to-business firm specializing in professional services.
Participants. All employees at the company were invited to participate in the experiment through an email solicitation. It was described as a research study seeking to better understand employee attitudes. A total of 165 individuals responded, the anonymity of whom was maintained throughout the research process.
Individual contributors comprised 74 percent of the participants; supervisors and managers, 21 percent; and directors and vice presidents, 5 percent. The tenure of the participants at the company ranged from under one year to over 20 years, with a modal tenure of 6 to 10 years. Females represented 80 percent of the participants. The modal age of all participants was 35 to 44 years old.
Materials. All participants in the experiment were provided with a journal in which to record their thoughts. A primary resource was a technology-based recognition system, which provides employees with the ability to electronically send certificates of appreciation. There are a number of features within the system, including the ability to copy other people, such as the recipient’s manager.
Experimental Design. Participants were randomly assigned to one of four experimental treatment groups (E1, E2, E3, and E4) or to a control group (C), and were asked to perform assigned activities over a continuous five-week period (see Figure 2). The activities required about two hours to complete per week during workdays. The four experimental treatments were constructed to represent increasingly stronger combinations of positive interventions, including journaling, peer-to-peer recognition, performing acts of kindness, and “gratitude visits.”2 A gratitude visit is when an employee personally delivers a recognition certificate to the recipient.
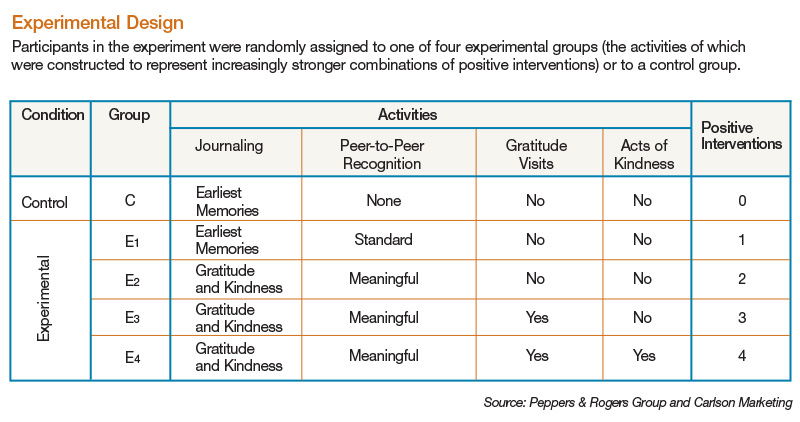
E1: Participants in this group were asked to maintain a journal, writing two entries per week about their earliest memories of events in the company, such as a humorous or stressful situation (constituting a placebo for the journaling activity). Additionally, members of this group were requested to use the technology system to send two peer-to-peer recognitions per week to colleagues.
E2: Participants in this group were also asked to maintain a journal, but were instructed to write two entries per week about events in the company for which they were grateful or acts of kindness observed in the workplace. Additionally, members of this group were requested to use the technology system to send two peer-to-peer recognition certificates per week to colleagues, and were provided with written instructions on how to make the communication especially meaningful to the recipient through the use of emotionally enriching words and phrases that communicate sincere appreciation.
E3: In addition to the activities described for E2, participants in this group were also asked to make gratitude visits,2 and were provided with written instructions on how to do so.
E4: In addition to the activities described for E3, participants in this group were asked to perform two acts of kindness in the workplace per week, and were provided with written instructions describing examples of possible acts to consider.
To provide a baseline comparison over the duration of the experiment, a control group was utilized.
C: Participants in this group were asked to maintain a journal, writing two entries per week about their earliest memories of events in the company, such as a humorous or stressful situation (constituting a placebo for the journaling activity).
Procedure. During the first week, introductory meetings for members of each group provided an overview of the process and training on the activities. On Mondays of the following weeks each participant received an email with weekly instructions. Every Friday the participants received another email with a link to an online questionnaire. Participants who completed all questionnaires were entered into a prize drawing for gift cards after the conclusion of the experiment.
A website for each group was constructed to allow participants to ask questions anonymously about the activities and to share their experiences with fellow group members. To minimize the likelihood of employees in different groups comparing their assigned activities, participants were asked to limit all discussions about this research to the website forum.
Data Collection. Throughout the entire five-week research period, all participants were asked to complete a weekly online questionnaire (see Figure 3). During the introductory week of the research, the following categories of information were gathered:
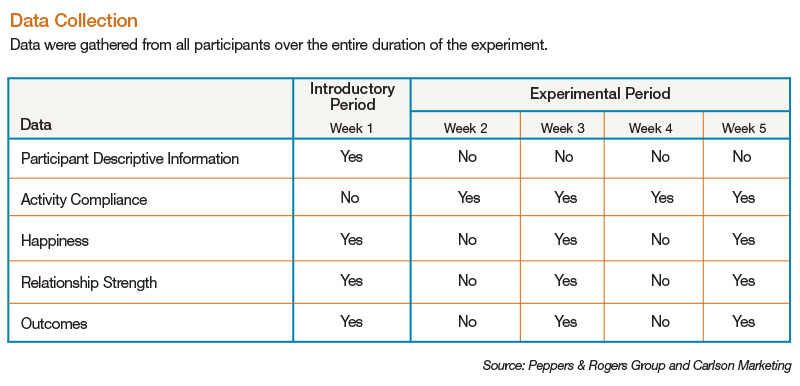
- Participant descriptive information, such as tenure at the company, gender, and age
- Measurements of happiness, using an 11-point happiness/unhappiness scale and a question asking the percent of time the individual was happy, unhappy, or neutral11
- A measurement of relationship strength (RSx), encompassing trust toward, alignment with, and commitment to the company by the employee
- Measurements of business outcomes, including employee productivity, retention, and job satisfaction
Participants started their assigned activities beginning the second week of the experiment. From the second through the fifth weeks, measurements of the extent to which each activity was completed (e.g., the number of journal entries made and the number of peer-to-peer recognition certificates sent) were also gathered.
Lastly, the measurements of happiness, relationship strength, and outcomes were additionally gathered during the third and fifth weeks of the experiment.
Results As expected by the random assignment of participants to groups, there were no statistically significant differences among the five groups on each of the happiness, relationship strength, productivity, retention, and job satisfaction measures at week 1 of the research.
The extent to which participants completed or exceeded the number of each of their assigned activities varied by group and by week. By group, activity compliance ranged from a high of 76 percent for group E2 to a low of 47 percent for group E3. By week, compliance decreased from a high of 73 percent in week 2 to a low of 52 percent in week 5. Overall, across groups and weeks, 63 percent of participants were compliant with the activity requests.
Attrition across all groups over the five-week duration of the research was relatively even, averaging 51 percent. As a consequence, the average group size of 33 participants at week 1 was reduced to 16 at week 5, negatively impacting the power of the experiment to detect mean differences between groups—especially over an activity period as short as four weeks.8
As a consequence, a correlation approach was adopted to analyze the hypotheses based on (a) the group membership of the participants (numerically designated 1 through 5 representing C, E1, E2, E3, and E4), reflecting increasingly stronger combinations of positive interventions; and (b) measurements of happiness, relationship strength, and outcomes gathered during the final week of the experiment. A compliance score, indicating the proportion of assigned activities completed by the participants, was derived and used to weight all analyses.
All six hypotheses (see Figure 1) explored were empirically supported.
H1: Positive Interventions > Happiness. The level of positive interventions was significantly correlated with both the percent of time participants reported being happy (r=0.25, p<0.05) and participants’ net time happiness (i.e., the percent of time happy minus the percent of time unhappy; r=0.26, p<0.05).
H2: Positive Interventions > Relationship Strength. The level of positive interventions was significantly correlated with relationship strength overall (r=0.28, p<0.05), as well as to its trust (r=0.27, p<0.05), alignment (r=0.24, p<0.05), and commitment (r=0.27, p<0.05) components.
H3: Happiness > Relationship Strength. Happiness is significantly correlated with relationship strength, as measured by the absolute level of happiness (r=0.23, p<0.05), percent time happy (r=0.32, p<0.01) and net time happiness (r=0.26, p<0.05).
H4: Relationship Strength > Productivity. Relationship strength is significantly correlated with employee productivity overall (r=0.56, p<0.01), as well as with all seven individual questionnaire items that comprised the aggregate measure (e.g., “I put in extra effort to make the company more successful” and “I look for ways to save the company time and money”).
H5: Relationship Strength > Retention. Relationship strength is significantly correlated with employee retention overall (r=0.74, p<0.01), and with both its short-term (“I intend to stay with the company for the foreseeable future”) and long-term (“I plan to have a long career at the company”) components.
H6: Relationship Strength > Job Satisfac-tion. Relationship strength is significantly correlated with employee job satisfaction overall (r=0.88, p<0.01), and with each of the three components that comprised the aggregate measure (e.g., “I am very satisfied with my job at the company overall”).
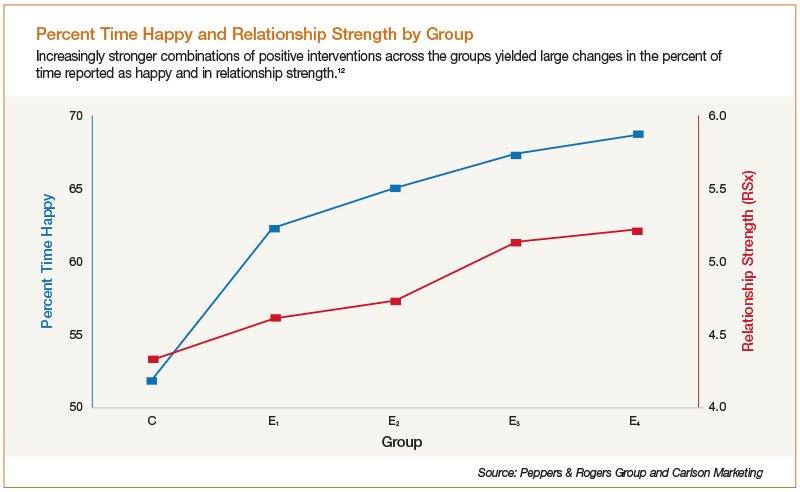
As the potency of the positive interventions increased across the groups, the percent time happy for participants increased by 33 percent (from 52 to 69 percent) and the strength of the relationship improved by 21 percent (from 4.3 to 5.2; see Figure 4).
Relative to the control, the experimental groups produced increases in the measurements of productivity, retention, and job satisfaction up to 7 percent, 10 percent, and 20 percent, respectively.
Discussion This research has demonstrated that positive interventions with employees—even simple activities over brief durations—significantly impact their happiness and the strength of their relationship with the employer, as compared to a placebo control. These activities may passively increase awareness of the good things that happen in the workplace, through activities such as journaling and sending peer-to-peer recognition certificates; and, they may actively increase the frequency of those good things, through conducting acts of gratitude (i.e., personally delivering a peer-to-peer recognition certificate to the recipient) and kindness (e.g., driving a colleague to a dealership for an automobile repair, or taking coworkers from a different department out to lunch).
The occurrence of these effects in this research was especially noteworthy, given that the employee population was experiencing anxiety about potential job loss at that time. Shortly before beginning the experiment, the company implemented a reduction in force in which job positions were eliminated and additional layoffs were generally anticipated. Yet, even under conditions of organizational stress, the positive interventions were successful in heightening happiness and improving the strength of the relationship with the employer.
These findings are consistent with existing research showing, for example, significant impact on the happiness of individuals who write and deliver a letter of gratitude in person.2 This experiment, however, extends prior research by demonstrating that those same positive interventions also (directly and indirectly through happiness) correlate with the strength of the relationship between the employee and employer. Additionally, it has been shown that the strength of that relationship is correlated with self-reported improvements in important business outcomes: productivity, intent to stay, and job satisfaction. It is reasonable to speculate that the same positive interventions—if encouraged and reinforced by company leadership and through ongoing communications over an extended duration—would yield even more impressive results.
The implications are clear and important. Enhancing employee awareness and expressions of gratitude and kindness in the workplace isn’t just good for camaraderie and collegiality—it’s good for business, too.
-
Endnotes
- Seligman, M. & Csikszentmihalyi, M. (2000). Positive psychology: An introduction. American Psychologist, 55, 5–14.
- Seligman, M., Steen, T., Park, N. & Peterson, C. (2005). Positive psychology progress: Empirical validation of interventions. American Psychologist, 60, 410–421.
- Dutton, J. & Sonenshein, S. (2009). Positive organizational scholarship. In S. Lopez (Ed.), The Encyclopedia of Positive Psychology (pp. 737–742). Malden, MA: Wiley-Blackwell.
- Lyubomirsky, S., King, L. & Diener, E. (2005). The benefits of frequent positive affect: Does happiness lead to success? Psychological Bulletin, 131, 803–855.
- Norrish, J. & Vella-Brodrick, D. (2008). Is the study of happiness a worthy scientific pursuit? Social Indicators Research, 87, 393–407.
- Seligman, M. (2004). Can happiness be taught? Daedalus, 133(2), 80–87.
- Fordyce, M. (1977). Development of a program to increase personal happiness. Journal of Counseling Psychology, 24, 511–521.
- Fordyce, M. (1983). A program to increase happiness: Further studies. Journal of Counseling Psychology, 30, 483–498.
- Emmons, R. & McCullough, M. (2003). Counting blessings versus burdens: Experimental studies of gratitude and subjective well-being. Journal of Personality and Social Psychology, 84, 377–389.
- Otake, K., Shimai, S., Tanaka-Matsumi, J., Otsui, K. & Fredrickson, B. (2006). Happy people become happier through kindness: A counting kindnesses intervention. Journal of Happiness Studies, 7, 361–375.
- Fordyce, M. (1987). A review of research on the happiness measures. Social Indicators Research, 20, 355–381.