
Hit the AHT Sweet Spot
Without context, average handle time loses its luster.
Astronomers call it the “Goldilocks zone”—a mix of a planet’s ideal size, atmospheric conditions, and distance from a star that make it hospitable for water and maybe life. If it’s too hot, water boils away. Too cold, and it’s a frozen, dead planet. Each planetary attribute must fall within a certain range in order to be considered in the perfect zone.
In July 2015, NASA announced it had found a planet that fits the bill. Kepler-452b was nicknamed “Earth 2.0” by scientists because of how much it fits into the Goldilocks sweet spot of conditions. The agency’s next step is to figure out how to travel 1,400 light years away to explore it.
Many contact centers are also looking to find their own Kepler-452b by creating an ideal balance of efficient operations and customer centricity. Too much focus on efficiency metrics reduces the quality of the experience, while emphasis only on customer results depletes money and resources in a cost-driven discipline. The struggle to find the ideal scenario has eluded many companies. As a result, most contact centers simply measure and manage individual metrics, without understanding how they influence one another.
Instead of just measuring the right things, companies must also measure them in the right way. Contact Center Sweet Spot Analysis digs into how individual metrics impact efficiency and effectiveness on a holistic level. Mapping these metrics together, companies can plot an area we call the sweet spot—where the costs of doing business positively align to outcomes and drive desired customer behaviors.
AHT sweet spot
One obvious metric to analyze is average handle time (AHT). It’s one of the most common efficiency metrics, and nearly every contact center contract is built around AHT thresholds and caps set by contact center leaders. It’s defined as the time it takes associates (or the center cumulatively) to handle a task, including the call, hold time, and wrap-up time. It’s time where associates are busy and unable to work on new tasks.
AHT targets run the gamut from seconds to hours, depending on the call type, customer value, or complexity of the issue. Most simple transactions fall within the range of a few minutes. But where do AHT targets actually come from?
Most AHT targets are created based solely on efficiency calculations—how fast can an associate handle an interaction based on the speed of systems, script reading time, and data processing time, for example. Without looking at AHT in a larger experience context, however, the quality of the interaction may suffer. Associates nearing their AHT target limit may transfer a call or hang up to save their performance, at the disservice of the customer and the company’s reputation.
Or maybe the associate will rush a customer off the call with the wrong information, as recently happened to a colleague who rented a car in Europe. She was running low on fuel in the French countryside, but didn’t know if the car took unleaded gas or diesel. The local rental agency branch was closed for the evening so she called the contact center. The first associate transferred her to someone else, who placed the customer on hold for many minutes. When the associate finally got back on the phone, she sheepishly told the customer “diesel,” then hung up. Unconvinced this was the right answer, our friend went to the rental car agency the next morning only to find out it was indeed unleaded, as she had suspected. This was a poor experience for the customer, and nearly cost the company a new engine.
Instead of looking at metrics in a vacuum, data analysis can help the contact center look outside itself to determine how a shift in AHT will positively impact other areas of the business like customer satisfaction, Net Promoter Score (NPS), or even sales. What is the Goldilocks “sweet spot” where AHT and these other metrics hit optimal levels?
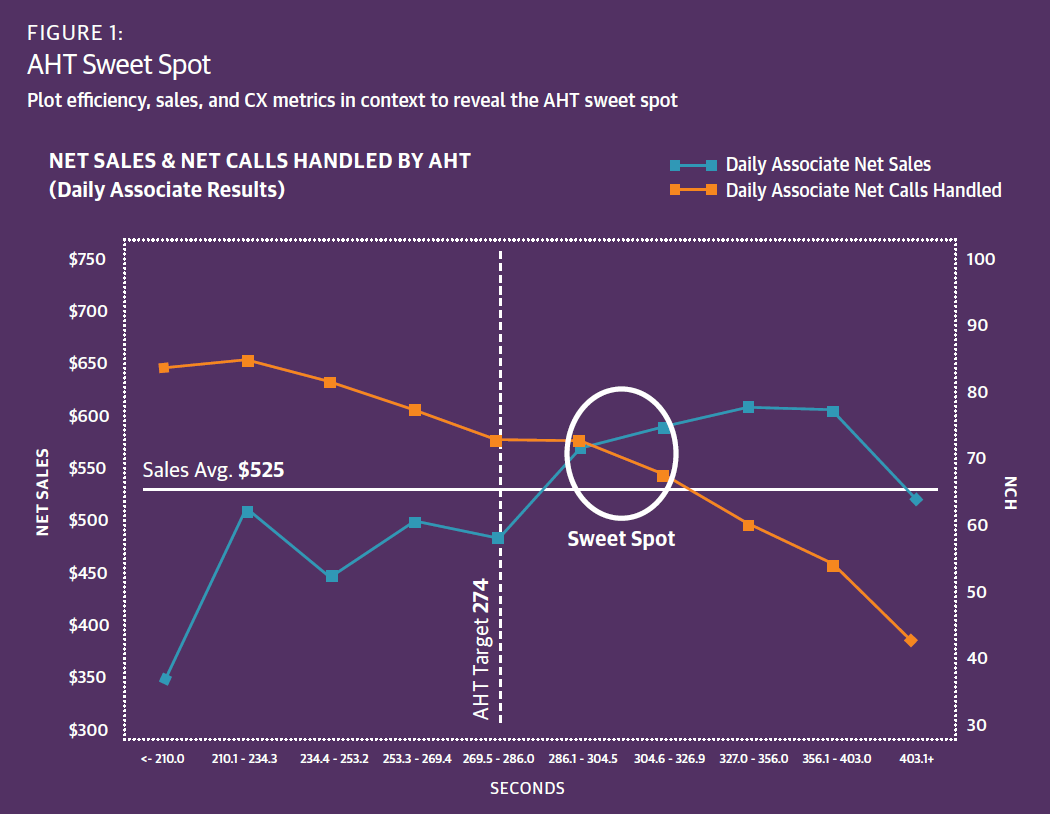
As shown in Figure 1, sometimes all it takes is a small uptick in handle time to boost sales. In this client example, a major retailer compared its AHT against daily associate net sales and net calls handled (NCH). While its AHT target was 274 seconds, analysis showed that moving it up 10-30 seconds improved the likelihood of more sales with negligible impact on net calls handled. This sweet spot circle showed leaders a positive long-term financial gain for a small increase in handle time costs. Any more than 30 seconds, however, and the sales revenue didn’t outweigh the costs of keeping customers on the phone longer.
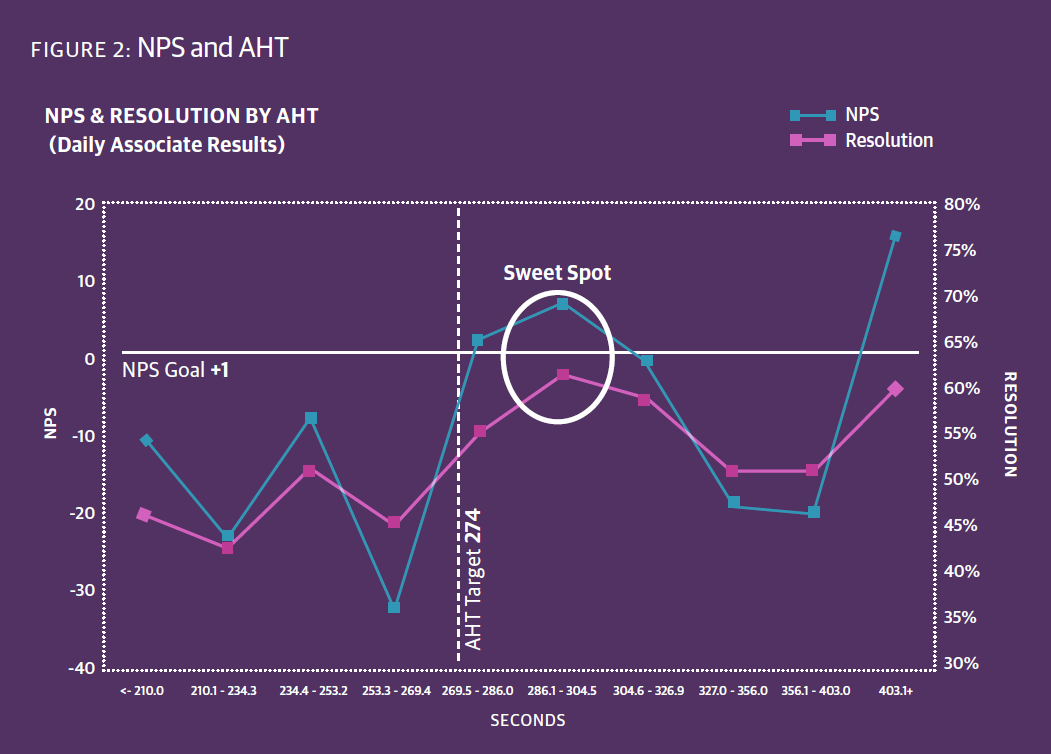
Further analysis was done to measure the customer experience, comparing customer NPS scores with handle time to resolve an issue (see Figure 2). Again the data revealed that the target AHT did not give associates enough time to resolve issues and meet NPS targets. Spending another 10-30 seconds above the target with customers on the call improved resolutions from about 55 percent to 61 percent, while boosting NPS well above its goal of +1. Any longer than that, and there was no real net benefit.
Also of note in this analysis is that the length of call did not correlate to higher rates of issue resolution. Just like Goldilocks, the interaction must be just right. If the call is too short, then customers don’t feel they’ve had their issue resolved. If it takes too long, customers start to feel as if their time is being wasted, and NPS and resolution both drop.
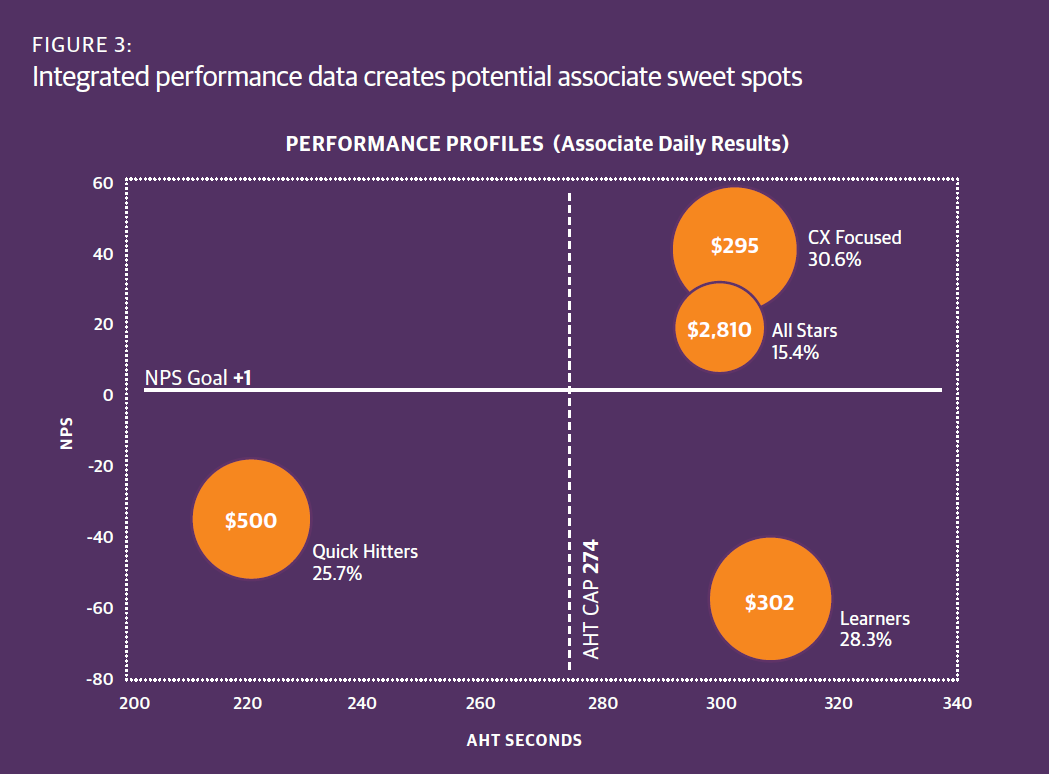
Even employee attributes and behaviors can be put into a sweet spot context, which gives contact center leaders valuable information about ideal training curriculum and productivity targets. As shown in Figure 3, our retail client integrated sales, AHT, and NPS data to identify four associate profiles—CX Focused, All Stars, Learners, and Quick Hitters. All Stars, while a small percentage of the workforce, outsold their colleagues by as much as tenfold. The company looked at attributes common among these associates, including tenure, assessment scores, amount of training, and soft skills. Changes to the training, development, and performance goals were recommended so the other associate groups could more likely become All Stars.
The most common metrics examined in Sweet Spot Analysis include NPS, customer satisfaction, sales, issue resolution, number of interactions, conversion, productivity, and customer churn. It’s best to measure data that can be taken directly from a call to prevent other variables from influencing a direct comparison.
And while this project focused on voice interactions, Sweet Spot Analysis may be also be done from chat, email, and other channel interactions, using metrics that matter to that specific channel.
Using this analysis, contact center leaders can make changes to their operations and success metrics that have near immediate impact. One healthcare client, for example, adjusted its AHT targets to more align with customer satisfaction goals. Another client, a satellite provider, eliminated AHT targets entirely after seeing the upside to a less restrictive contact center environment.
The key to AHT Sweet Spot Analysis success is to look at multiple metrics together that represent the entirety of the customer interaction. Too often, companies review their metrics in silos. Integrated analysis helps spur valuable, strategic trade-off conversations related to cost, quality, and customer relationships.
Sweet Spot Analysis isn’t an exact calculation. It mixes art and science to uncover ideal situations that matter to each unique business. It’s not a single point, it’s a range, much like NASA’s Goldilocks program, where in context multiple data points create just the right balance of efficiency and quality. With data on your side, the decisions become easier to make. How sweet it is.